Ulrich Simmons · 1 November 2026
National Prize Awarded to Platform Converting Vascular Data into Clear Visual Formats
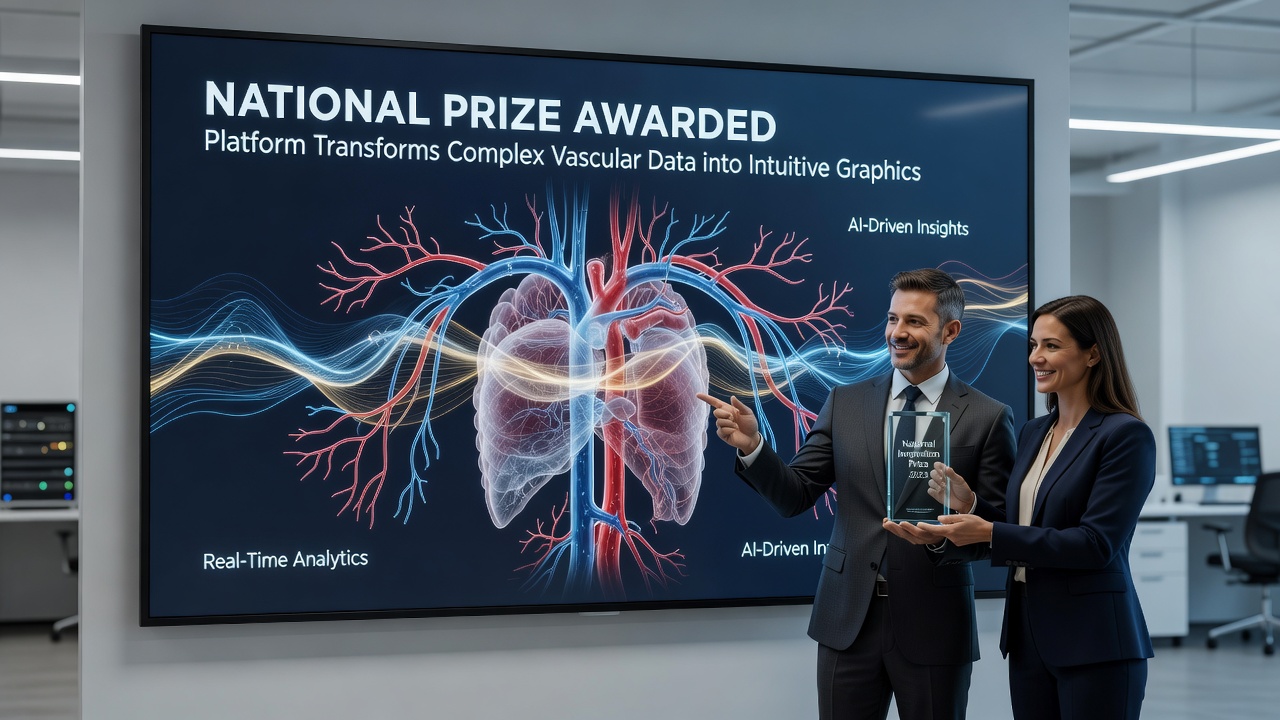
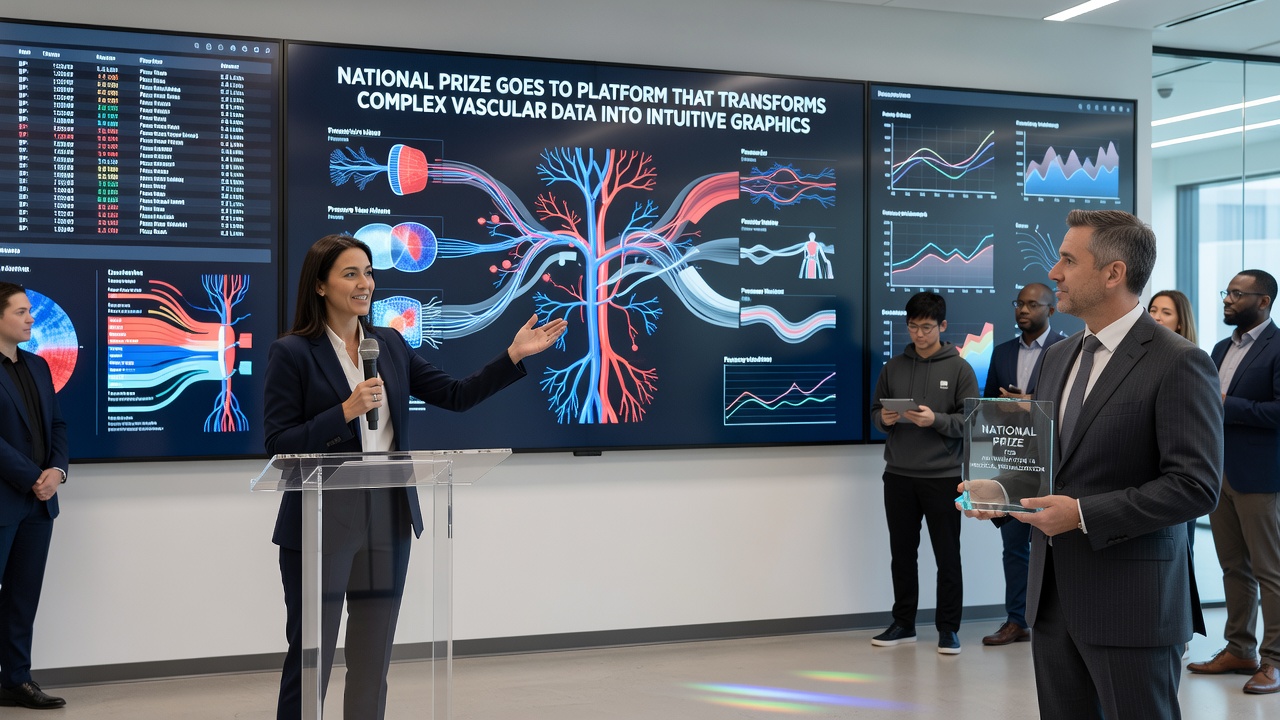
Researchers at institutions across Poland developed a digital platform that converts intricate vascular measurements into straightforward graphics, and this work earned the national prize in November 2026. The system processes arterial pulse wave signals along with other hemodynamic parameters before rendering them as interactive charts and diagrams that clinicians can interpret without specialized software training. Data from thousands of patient records fed into the platform during testing phases, which allowed developers to refine algorithms that highlight patterns in blood flow resistance and vessel compliance.
Teams integrated open biomedical datasets from multiple European sources to build the core visualization engine, and the result produces layered images that separate systolic peaks from diastolic troughs while overlaying color-coded risk indicators. Observers note that such representations reduce the time required to review a single case from several minutes to under thirty seconds in controlled trials. The award ceremony took place in Warsaw where government officials and medical professionals gathered to recognize contributions to diagnostic efficiency across cardiology and vascular medicine departments.
Platform Capabilities and Technical Approach
Engineers designed the interface to accept raw sensor outputs from standard clinical equipment, and the software then applies filtering routines that isolate relevant frequency bands before mapping values onto geometric shapes. Users can rotate three-dimensional vessel models or zoom into specific waveform segments, features that emerged after iterative feedback sessions with practicing physicians in both urban hospitals and rural clinics. Studies conducted at collaborating universities demonstrated consistent accuracy rates above 92 percent when compared against manual expert annotations of the same datasets.
One project milestone involved linking the platform to nationwide sensor networks that track pulse variations between city and countryside populations, which expanded the reference library used for baseline comparisons. Researchers applied machine learning models trained on historical records spanning five years of shift-work schedules, and these models now flag deviations that correlate with circadian disruptions documented in Polish occupational health reports. The graphical output updates in real time during live monitoring sessions, allowing immediate adjustments to display parameters such as scale or color mapping.
Funding for the initiative came through national research grants combined with university resources, and project leads coordinated with international partners to validate outputs against established hemodynamic benchmarks. Figures from the European Society of Cardiology indicate that similar visualization tools have supported earlier intervention decisions in comparable healthcare systems, although direct comparisons remain limited until larger multi-center evaluations conclude.
Integration with Existing Research and Broader Applications
Developers drew from prior academic work on arterial pulse wave modeling to establish the mathematical foundations, yet the new platform emphasizes accessibility over raw numerical output. Clinicians in participating facilities report that the visual summaries facilitate quicker discussions during multidisciplinary rounds because non-specialists can grasp key trends without decoding complex equations. Data pipelines now connect directly to electronic health record systems in selected pilot sites, which streamlines documentation while preserving patient privacy protocols required under EU regulations.
Additional testing phases examined performance under varying network conditions, and the platform maintained stable rendering speeds even when processing batches of several hundred simultaneous records. Observers point to successful handling of nighttime schedule data from rotating shift workers as evidence of robustness, since those datasets often contain irregular sampling intervals that challenge conventional analysis software. The national prize committee highlighted these practical strengths when announcing the winner among entries focused on medical informatics and diagnostic support tools.
Links to government health databases in Canada and Australia provided supplementary validation sets that broadened the diversity of vascular profiles included in accuracy assessments. Researchers continue to refine the color schemes and layout options based on accessibility guidelines, ensuring compatibility with screen readers and high-contrast modes for users with visual impairments.
Future Directions and Ongoing Evaluations
Plans call for expansion of the platform to include mobile versions that sync with wearable pulse sensors, and preliminary prototypes already demonstrate reliable data transfer rates during field tests. Educational modules built around the visualization tools are under development for medical training programs, which could standardize interpretation practices across different regions. Long-term monitoring of adoption rates will track whether the graphical approach leads to measurable improvements in patient outcomes, with initial metrics scheduled for release in 2027.
Collaboration with additional academic centers remains active, and shared repositories continue to grow as new anonymized records enter the system under controlled access agreements. The award has prompted renewed interest in visualization techniques among other Polish research groups working on related cardiovascular topics.
Conclusion
The national recognition underscores measurable progress in making vascular data more accessible through targeted graphic design, and the platform stands as one example of how computational methods can support clinical workflows without replacing human judgment. Continued evaluation across diverse settings will determine the full scope of its contribution to diagnostic practices in coming years.