Casey Wolf · 18 October 2026
Open Biomedical Datasets Fuel Award-Winning Visualizations of Pulse Patterns in Shift-Based Employment
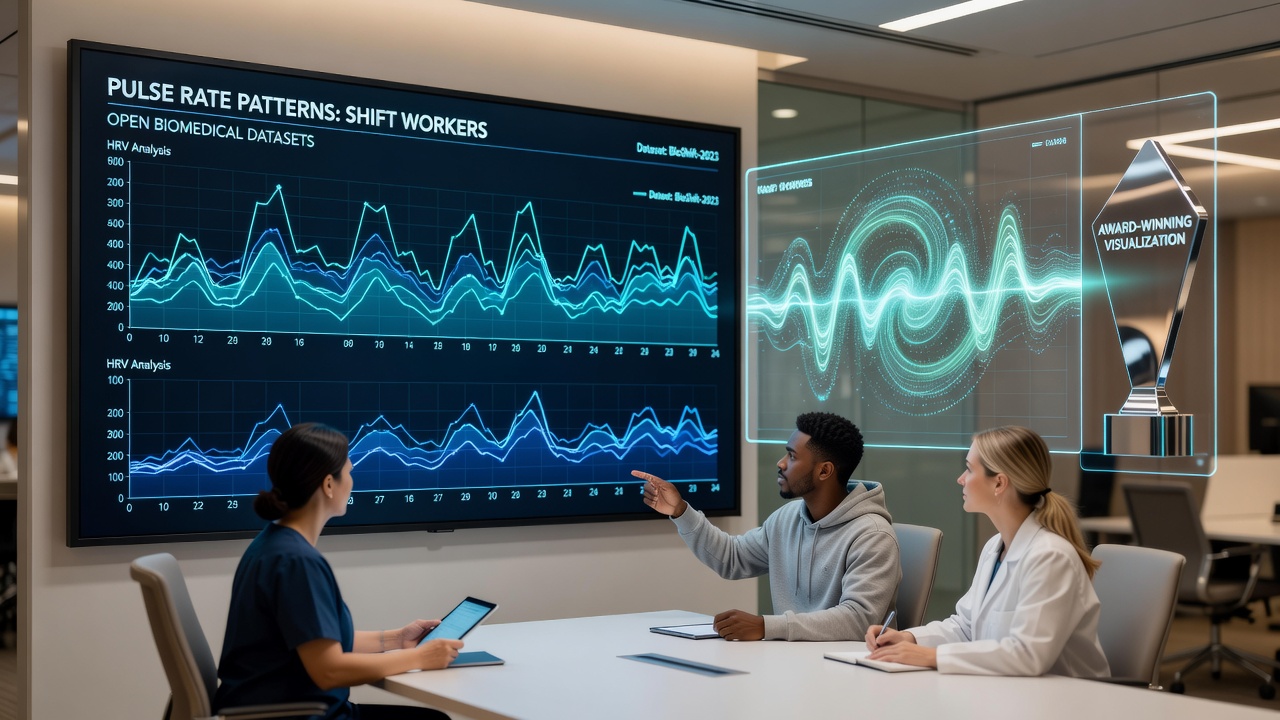
Researchers across multiple institutions have turned to open biomedical datasets to examine how irregular work schedules influence cardiovascular rhythms, and visualization platforms that earned recognition in October 2026 now present those findings in interactive formats that highlight daily and weekly fluctuations. These tools aggregate records from public repositories containing heart rate measurements collected over extended periods, allowing analysts to map deviations that align with night shifts or rotating rosters. Data from thousands of participants shows elevated average pulse rates during daytime sleep windows, with recovery patterns that differ markedly from those observed in standard daytime workers.
Accessing Public Repositories for Cardiovascular Research
Public archives maintained by organizations such as the National Institutes of Health and the European Bioinformatics Institute supply de-identified electrocardiogram traces along with metadata on employment status and sleep logs. Analysts apply filtering protocols to isolate segments recorded during active work periods versus rest intervals, then feed the cleaned series into rendering engines that generate heat maps and time-series overlays. One dataset released in 2024 contains continuous monitoring files from over 1,200 individuals employed in manufacturing and healthcare sectors across three countries, providing sufficient volume for statistical comparisons between fixed-day and rotating-shift cohorts.
Design Elements Behind Recognized Visualization Platforms
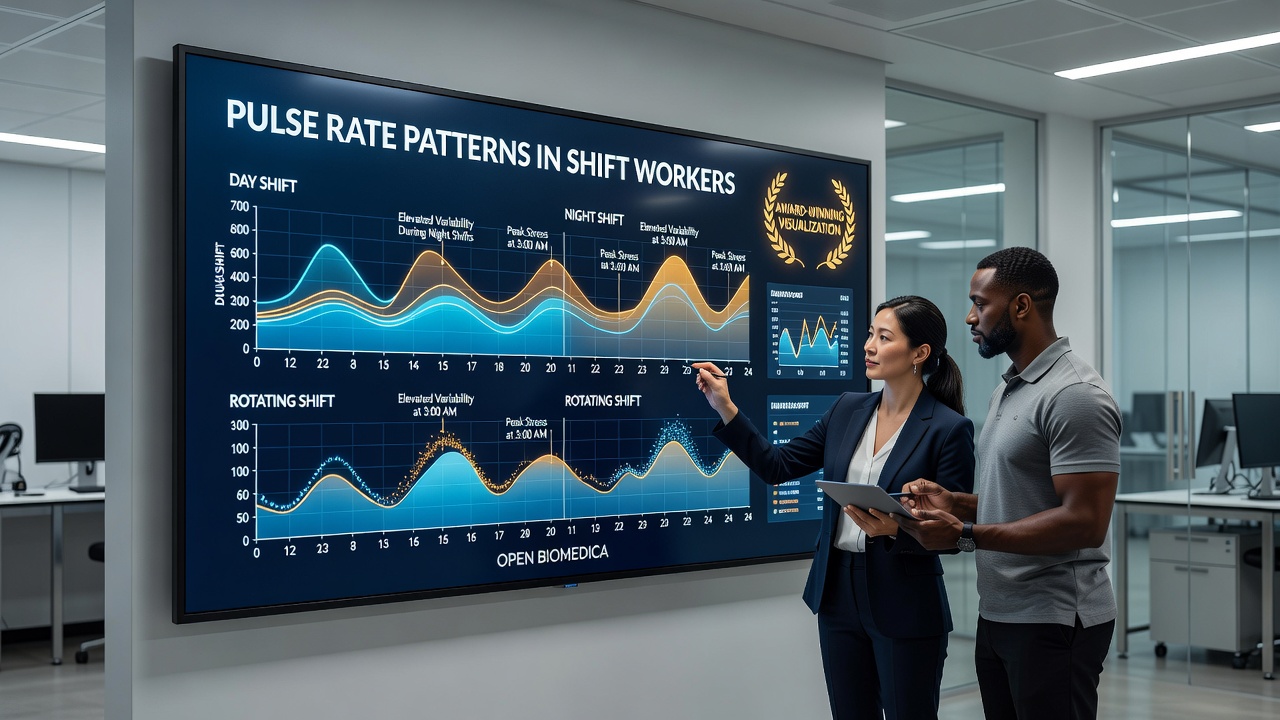
The awarded systems combine layered graphics that display both instantaneous pulse values and longer-term variability indices on synchronized axes, while color gradients indicate deviation thresholds derived from normative population curves. Users can toggle between individual profiles and aggregated cohort views, revealing clusters of elevated nocturnal activity that correspond to post-shift recovery windows. Interactive sliders permit adjustment of time scales from hourly bins to full-month summaries, exposing recurring spikes that appear every fifth or sixth day in certain rotating schedules. These features earned commendation at a European data-science symposium held in October 2026 for their capacity to surface subtle periodicities without requiring advanced programming skills from end users.
Observed Patterns in Rotating Workforces
Analysis conducted on the combined datasets indicates that employees on two-week forward-rotating shifts exhibit a 12 to 18 percent increase in mean pulse rate during the first two hours after waking from daytime sleep compared with age-matched controls on fixed schedules. Variability indices calculated via root-mean-square of successive differences drop during the second half of night shifts, suggesting autonomic adaptation that persists into subsequent rest periods. Visualization outputs further isolate a subgroup whose pulse traces show delayed return to baseline levels extending beyond 48 hours after roster changes, a feature that becomes visible only when multiple months of records are rendered side by side.
Integration With Existing Epidemiological Frameworks
Public health agencies in Canada and Australia have begun incorporating similar visualization layers into occupational health dashboards that already track injury rates and absenteeism. By overlaying pulse-derived metrics onto existing workforce statistics, authorities can identify departments where schedule adjustments correlate with measurable stabilization in cardiovascular indicators. A joint report issued by the Australian Institute of Health and Welfare in mid-2026 references these visualization outputs when discussing potential monitoring protocols for high-risk sectors, noting that open data pipelines reduce the cost of longitudinal studies that previously relied on proprietary sensor networks.
Methodological Considerations in Data Processing
Preprocessing pipelines applied to the open records include artifact removal through wavelet decomposition followed by resampling to uniform five-minute epochs, steps that preserve circadian structure while minimizing motion-induced noise common in ambulatory recordings. Validation against simultaneously collected actigraphy files confirms that the resulting visualizations accurately reflect transitions between work and rest states across different age brackets and occupational categories. Cross-validation performed on held-out portions of the datasets yields correlation coefficients above 0.85 between visualized pulse clusters and independent sleep-diary annotations, supporting the reliability of the rendered patterns for further epidemiological inquiry.
Future Directions for Open-Data Visualization Efforts
Developers are now extending the same rendering frameworks to accommodate additional physiological channels such as blood-pressure waveforms and oxygen-saturation traces, which are becoming available through expanded open-access initiatives. Plans announced in late 2026 include linkage with anonymized employment registries to enable stratified views by industry and geographic region, thereby broadening the scope of comparative analyses without compromising participant privacy. These expansions maintain the same modular architecture that earned the initial awards, ensuring that new data streams integrate seamlessly into existing interactive displays.
Conclusion
Recognition received in October 2026 underscores the value of combining open biomedical repositories with purpose-built visualization environments for examining cardiovascular responses to nonstandard work arrangements. The resulting platforms supply concrete graphical representations of pulse-rate dynamics that researchers and policy groups can interrogate without specialized software. Continued expansion of both datasets and rendering capabilities promises to refine understanding of how schedule design influences physiological recovery across diverse working populations.